When conducting needs assessments, program evaluations, or embarking on new projects, we rely on our go-to sources for...

Update: Our Go-To Sources for Getting Data
read more
Insights
We are educators at heart. We love sharing our expertise, actionable tips, and success stories that you can apply in your work!
When conducting needs assessments, program evaluations, or embarking on new projects, we rely on our go-to sources for...
Is your community striving to address complex social issues such as ending homelessness, solving the childcare crisis, or strengthening the workforce? These challenges require a collective effort; no single entity can tackle them alone. By using community indicators,...
Many communities struggle with low education, high poverty, and crime rates. Disinvestment hinders progress, but an anchor collaborative can help drive lasting change for a brighter future. As Montclair State University (Montclair) and Transform Consulting Group (TCG)...
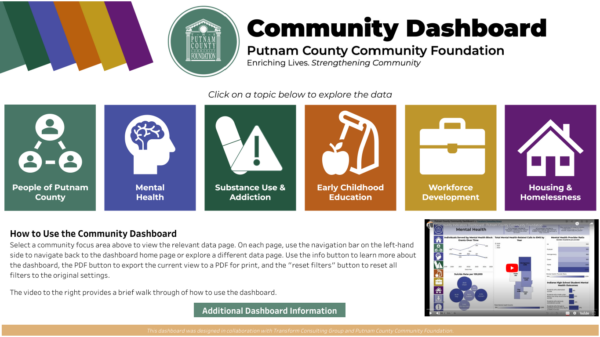
At Transform Consulting Group, we are passionate about empowering organizations to use data effectively to measure and achieve success! We take pride in guiding organizations to apply the best practices for visualizing data, turning complex information into...
Many nonprofit programs working with populations that have unique health needs must adhere to compliance regulations. However, compliance reporting often emphasizes outputs—such as the number of individuals served or the number of programs implemented—rather than...

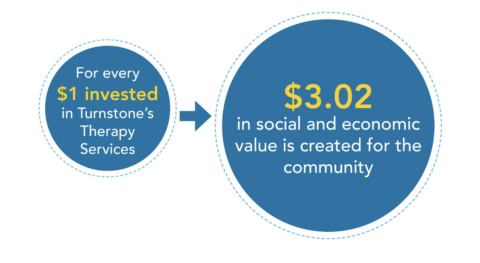
In the world of nonprofit investing, proving impact means looking beyond traditional ROI. While financial returns are measurable, they rarely reflect the full value of empowering individuals or strengthening communities. That’s where Social Return on Investment (SROI)...
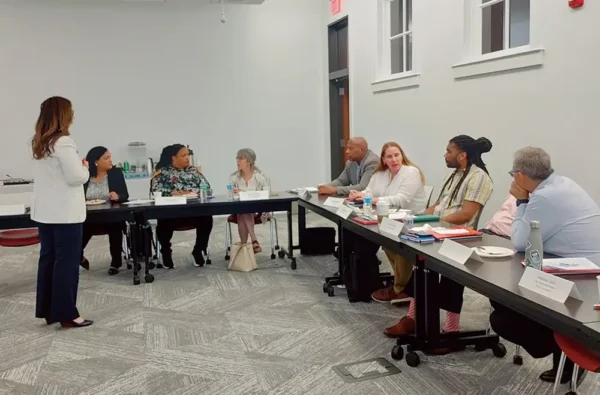
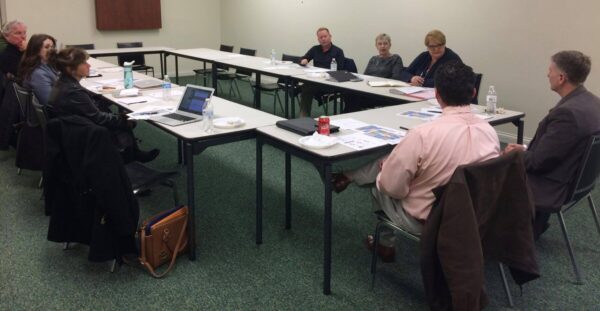
We have been sharing a series about our work with establishing and managing advisory councils. Advisory councils are a great vehicle to help your organization make informed decisions, navigate challenges, stay abreast of industry trends and best practices, and build...

If you have served on an advisory council before or have had to set up one, then you know that the PEOPLE on an advisory council can make it or break it. An Advisory Council is a group of individuals appointed or assembled to provide advice, guidance, and expertise on...

Another year is quickly coming to an end! Before you know it, we’ll be saying “Happy New Year”. We’re heading into the season of giving. It is the busy time of year when donor dollars increase significantly. Year-end giving trends suggest that nearly one-third of...

If you’ve followed along with Transform Consulting Group for a while, then you’ve probably seen us talk about our desire to work with you rather than for you. This is one of our many differentiators. We’re passionate about coming alongside you - our fellow...