Is your community working to address complex social issues such as homelessness, the childcare crisis, or workforce development? These challenges require collaboration, as no single organization can solve them alone. Community indicators help us understand root causes and track progress over time. Recently, communities have used data-driven insights to address key challenges. Community members, nonprofits, donors, and foundations have contributed by using these indicators to guide strategies and measure impact.
Understanding Community Need
Developing a baseline understanding of the current situation is a critical first step in addressing community issues. Gathering data from key indicators establishes this baseline and helps measure progress toward important goals. When communities align around clear objectives, they foster effective collective action.
The Role of Community Indicators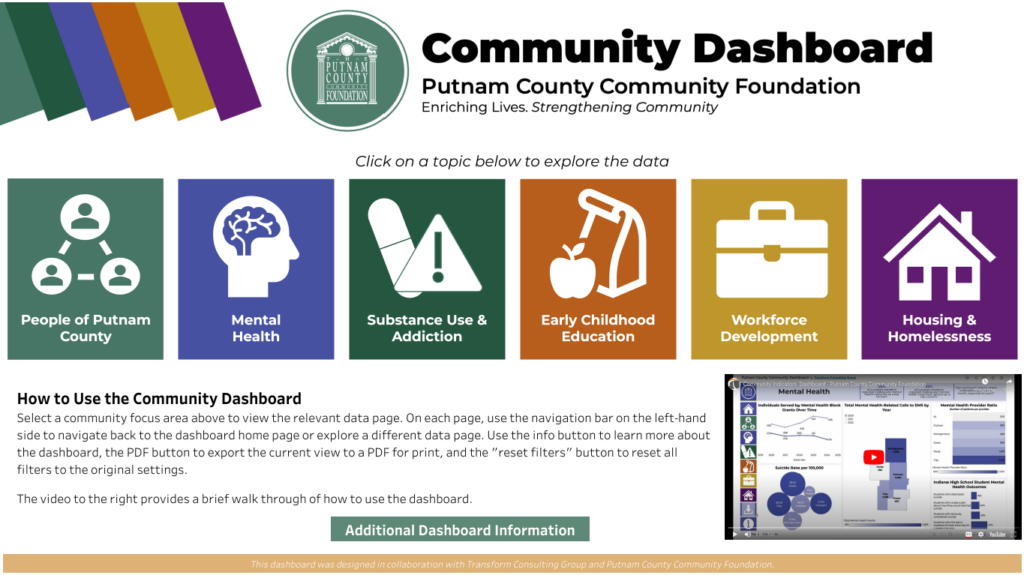
Community indicators support collaborative action toward shared goals, help measure progress, and identify areas needing attention. They also guide decision-making, inform collaboration, and maximize impact.
We have developed community indicator dashboards nationwide, working with local leaders to tailor them for diverse audiences.
In Putnam County, Indiana, we partnered with the Putnam County Community Foundation to develop and launch a dashboard covering five key areas: Mental Health, Substance Use and Addiction, Early Childhood Education, Workforce Development, and Housing. The dashboard integrates 50 indicators from more than 10 data sources. The foundation uses this tool to support nonprofit grantees and the broader community by providing data to inform decisions.
In Collier County, Florida, we worked with the Collier Community Foundation to develop a community indicators dashboard to inform their grantmaking, tell the story of their community’s needs and opportunities, and create an accessible tool for their community partners. Through the foundation’s prior work, they identified five community indicator topics: Housing, Health, Environment, Education, and Economic Opportunity. The Collier County community indicators dashboard is a comprehensive collection of 90 community indicators from over 20 data sources.
In Paterson, New Jersey, we partnered with Montclair State University and Paterson One Square Mile to develop a strategic housing action plan to strengthen the city’s future. We also designed a community indicators dashboard to track progress toward five housing goals: expanding affordability, increasing supply and stability, improving quality, creating safe neighborhoods, and building assets and wealth.
Benefits of Community Indicators
There are many benefits for communities in developing and sharing a community indicators dashboard. We highlighted a few benefits below.
- Support Data-Informed Decision-Making: Help communities establish clear indicators to ensure a collective understanding of key issues among organizations, donors, and community members.
- Highlight Community Needs: Help communities identify their strengths and opportunities for improvement to focus their efforts.
- Visualize Community Well-being: Help communities and partners “see” the current state of key indicators in their Community, along with supporting context, and use visual tools to make the data more dynamic and interactive.
- Communicate Impact: Help communities communicate their impact and demonstrate how needs are being met over time by measuring their progress toward reaching key indicators.
- Facilitate Collaboration: Provide communities with the data to enable partners to work together collectively and improve their impact.
When communities collaborate on key collective indicators, they can make meaningful progress on important social issues and drive measurable progress toward their targeted focus areas. If you are interested in learning more about our dashboard solutions, click here or contact a team member to schedule a complimentary discovery meeting.