Client Story
Location
Industry
Need
Project
Community Indicators Data Dashboard in Putnam County
The Challenge
Putnam County Community Foundation (PCCF) invests and administers funds to meet the needs of Putnam County, a rural community in Indiana. The PCCF highlights the community’s strengths and opportunities for improvement to help guide potential funding areas. As a community leader, the PCCF works to unite organizations and resources, creating solutions that can lead to sustainable results.
In 2023, the PCCF conducted a Community Needs Assessment (CNA) to determine where charitable dollars could evolve over time. The CNA helped to identify and prioritize needs and assets in Putnam County. The PCCF wanted to use the data gathered to inform the leadership role they can play in Putnam County.
Putnam County is a rural community home to nearly 37,000 residents. It is estimated that the population will remain the same for the next twenty years.
Results from their CNA indicated that only one-third of residents felt extremely connected to their community. Further, residents noted that treatment for substance use and addiction, mental health resources, and affordable housing were among the top identified needs. Overall, there are opportunities to improve residents’ sense of belonging while making Putnam County a thriving community.
The PCCF realized the need for a community indicators dashboard in order to better understand opportunities and community assets. PCCF’s goal was to provide a user-friendly, one-stop spot for quality data related to key focus areas. Additionally, the PCCF saw an opportunity to further support nonprofit grantees – and the community as a whole – to provide a compilation of data so everyone can make data-informed decisions.
The Solution
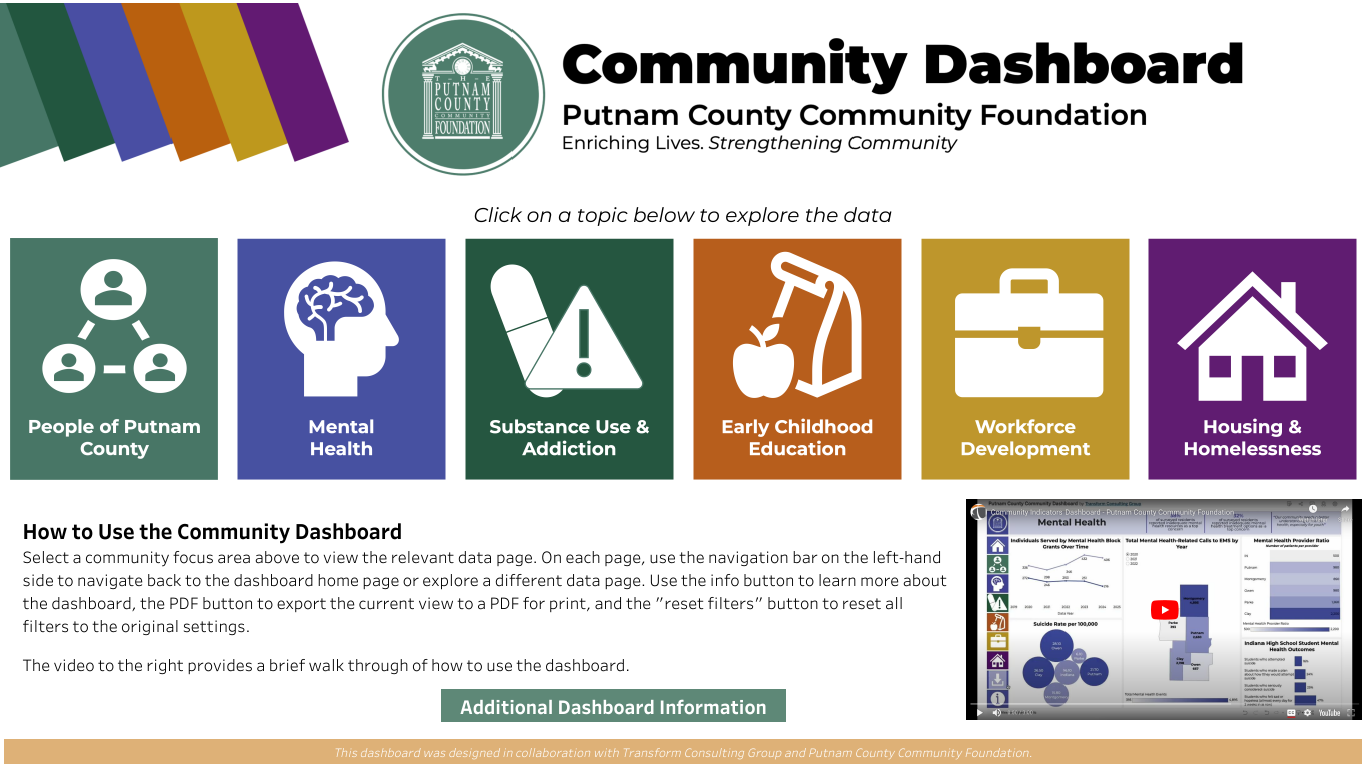
PCCF hired Transform Consulting Group (TCG) to create a community indicators data Dashboard. The Community Data Dashboard provides data on key indicators related to Mental Health, Substance Use and Addiction, Early Childhood Education, Workforce Development, and Housing.
The Putnam County community indicators dashboard is a curated collection of over 50 community indicators from over 10 data sources. It provides key information and data to inform community well-being and decision-making. The dashboard features tools to compare and contrast community indicators, rank key data, and provide trends on the change as well as many other features not available in static reports.
Our Role
TCG led the development of the community indicators data dashboard including:
- TCG collaborated with the PCCF to determine the audience, goals, and overall purpose of the dashboard.
- The identified goals included: 1) support data-informed decision-making for organizations, donors, and community members; 2) highlight community needs helping to identify strengths and opportunities for improvement; and 3) communicate impact and show how needs are being met over time.
- We also determined the areas of focus using the 2023 CNA: mental health, substance use and addiction, early childhood education, workforce development, and housing and homelessness. This laid a foundation for the types of data that would be included and collected.
- TCG compiled and analyzed data for each of the areas of focus. This included nearly 50 data points using over 10 data sources, including the U.S. Census Bureau’s American Community Survey, the Bureau of Labor Statistics, the Department of Education, and the U.S. Department of Housing and Urban Development, among others.
- TCG gathered data at the county township levels. We compared the area with surrounding Indiana counties and Indiana as a whole.
- TCG built the dashboard using a visual analytics platform called Tableau. As pages of the dashboard were formed, TCG shared them with the Community Foundation to gather feedback and ensure that the dashboard was designed to meet the needs of the targeted audiences.
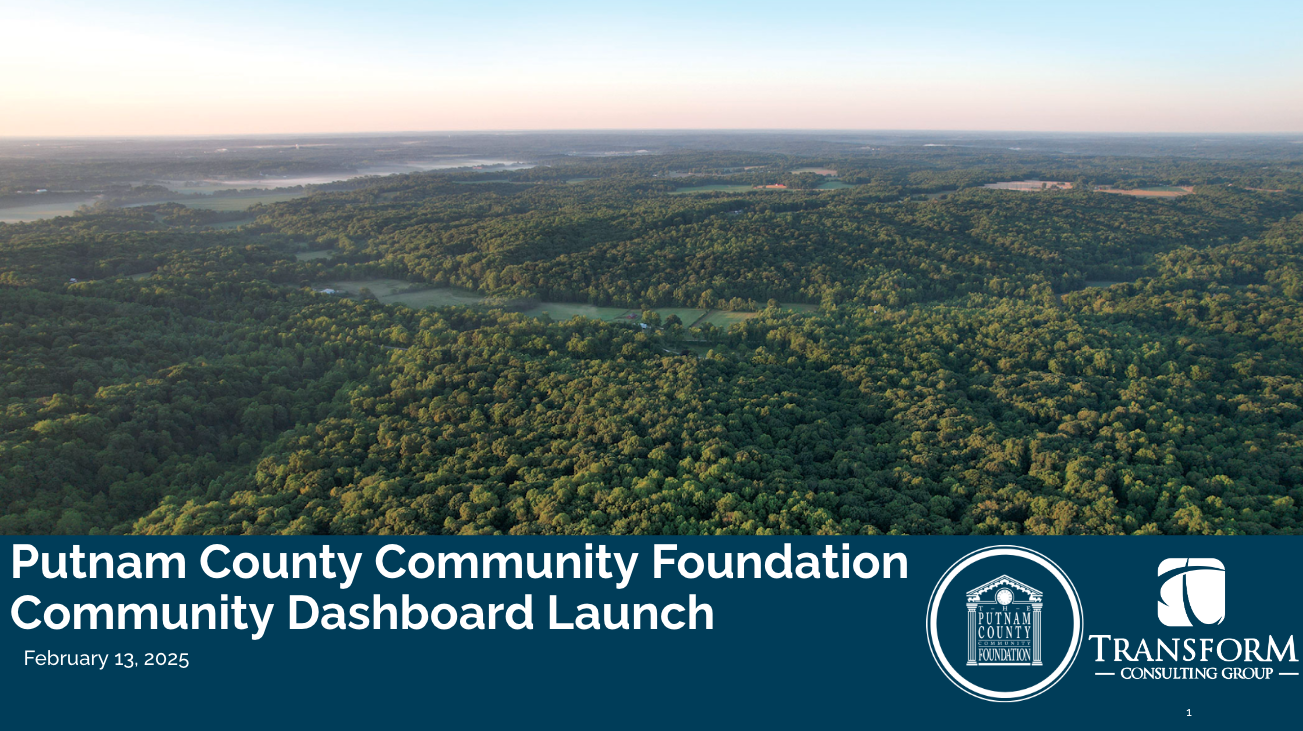
- TCG launched the dashboard with Putnam County stakeholders at a public event. During the launch, TCG provided a demonstration of how to utilize the dashboard, which is live on the Community Foundations’ website.
- TCG also created a video tutorial to show users how to navigate the dashboard, and it’s available on the dashboard website.
The Outcomes
Putnam County now has a comprehensive community indicators dashboard that lives on the Foundation’s website. Some key insights included in the dashboard are:
- People of Putnam County: There are 36,942 residents living in Putnam County, with the majority living in Greencastle. The median household income for the county is $76,182 which is lower than the state average of $88,805.
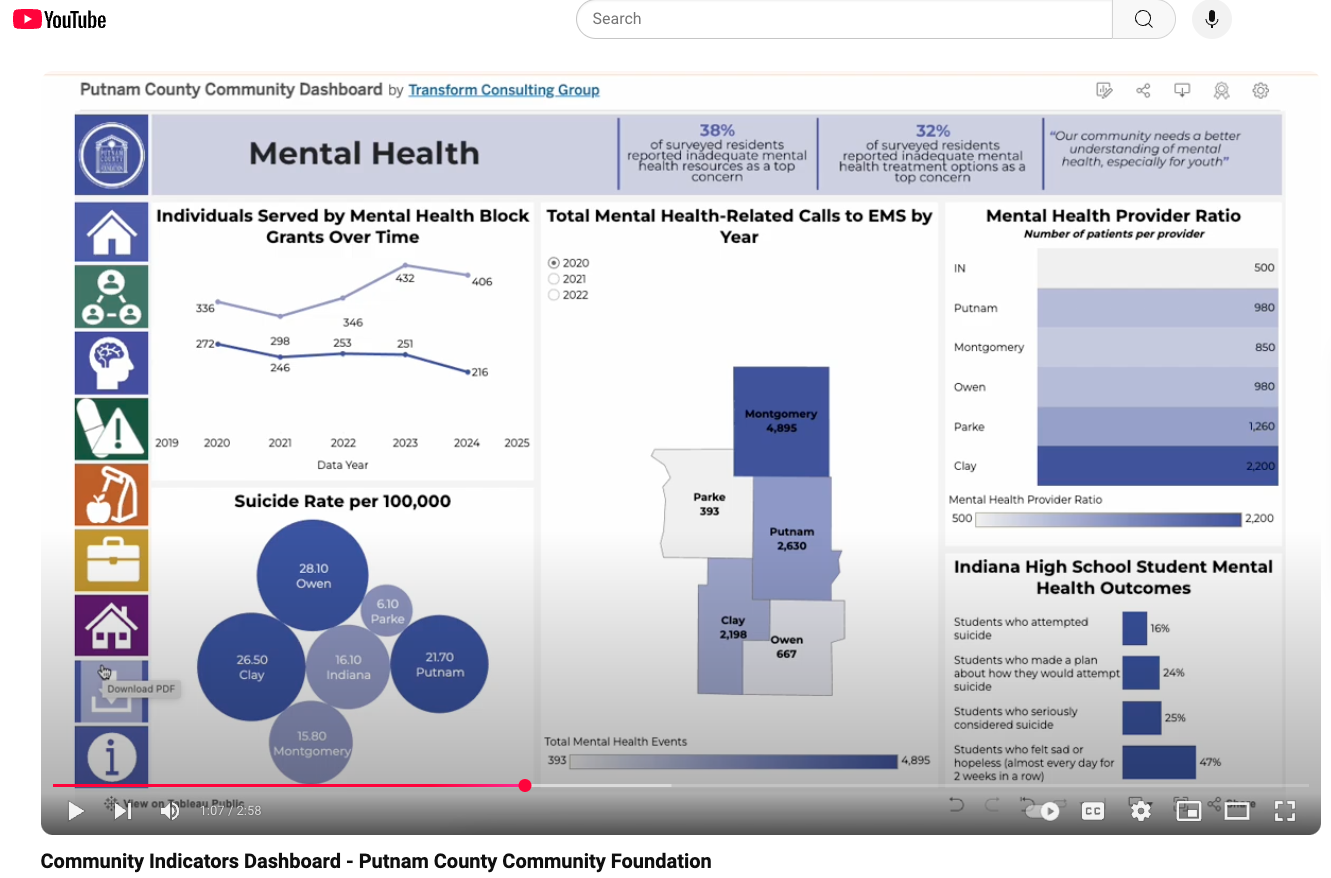
- Mental Health: Putnam County’s mental health provider ratio is double the state’s average (980:1, compared to the state at 500:1).
- Substance Use & Addiction: Putnam County’s age-adjusted overdose rate is 17 per 100,000, about two times lower than the state at 40 per 100,000.
- Early Childhood Education: There are a total of 361 known child care seats in Putnam County, with the majority located in Greencastle. Of those seats, only 33% are designated as high quality.
- Workforce Development: Putnam County’s unemployment rate is 1.6%, nearly two times lower than the state at 2.9%.
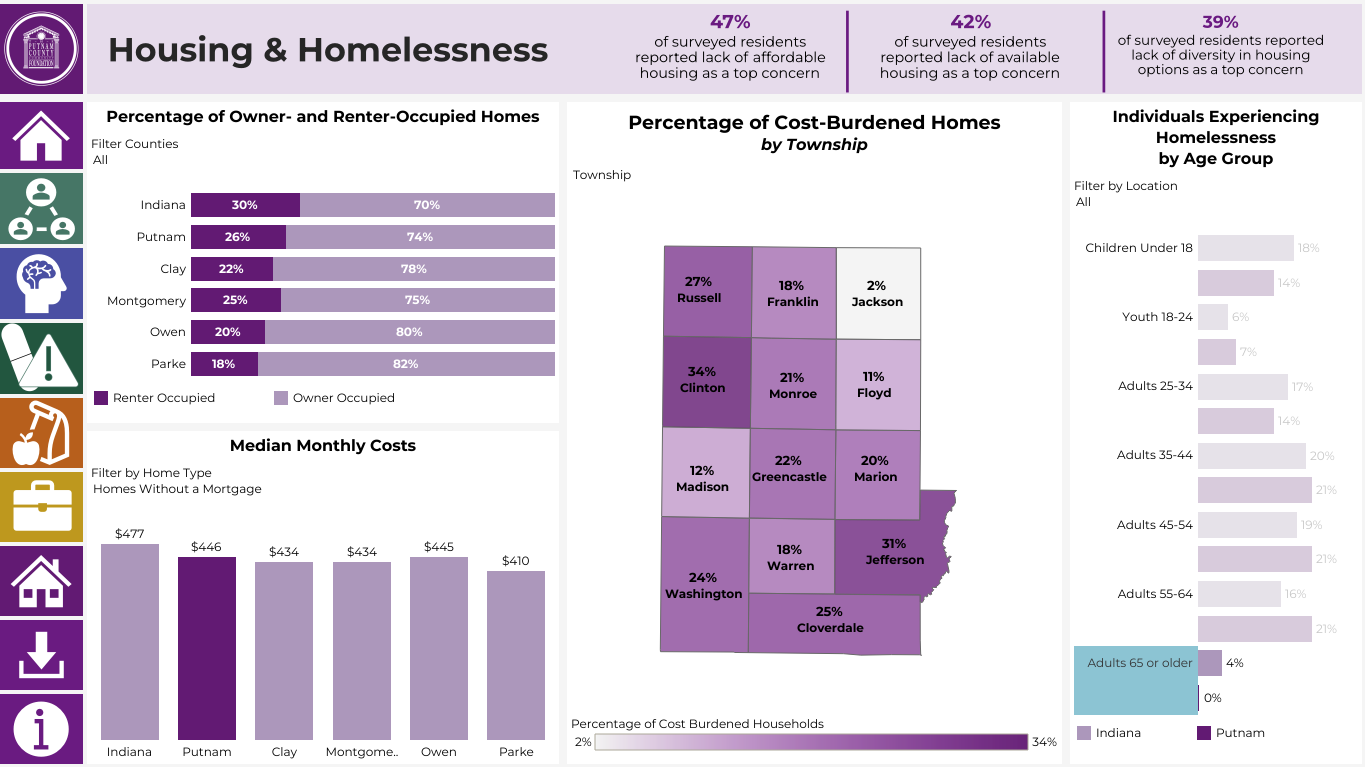
- Housing & Homelessness: One in five (21%) households are housing cost-burdened in the county, which is slightly lower than the state at 24%.
Learn More
- What’s the benefit of community indicators?
- Identifying and Understanding a Florida Community with a Community Indicators Dashboard: Collier Community Foundation Case Study
- Place-Based, Hyper-Local Collective Impact: Montclair State University Case Study
- Building a Community Indicators Dashboard for Community Impact Initiatives: Community Foundation of Greater Fort Wayne Case Study
- Build a Data Dashboard in 7 Steps
Our Client Stories


Let's Transform the WorldOver Coffee