
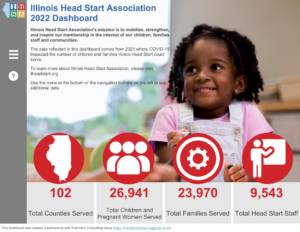
We’re excited to share one example of this in today’s blog! The Illinois Head Start Association approached us to help them present and share their data more meaningfully for all of their stakeholders. We walked them through our seven-step data dashboard development process (download our free tool here) to help create a way to make their data more accessible and user-friendly. View the dashboard here and check out our video highlighting the features here.
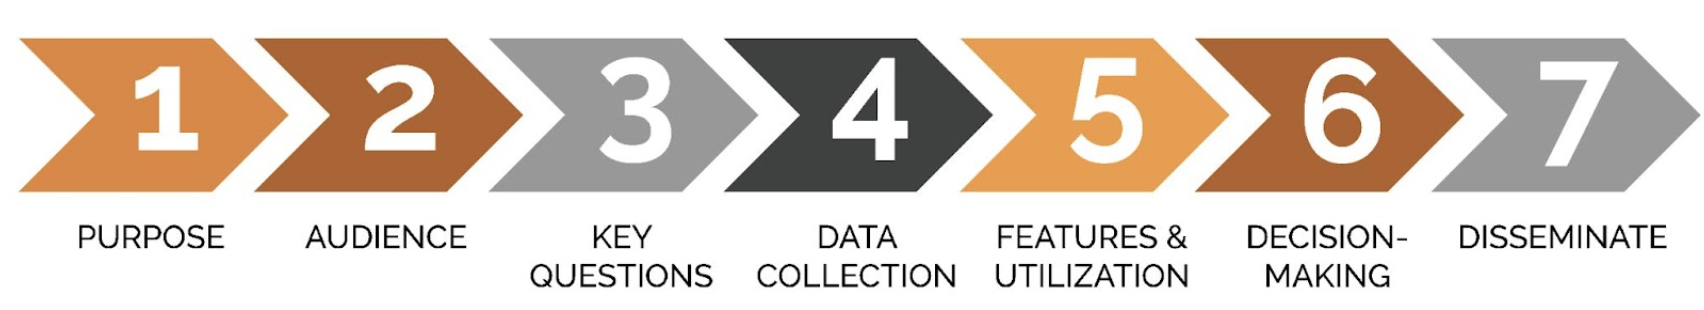
1. Purpose
This is the why. Why do we want this dashboard? What is the primary goal of the dashboard? How will we know the dashboard is successful? How will it add value to the field? Knowing the purpose is most important because we want to ensure we create a data dashboard that is fully utilized.
For the Illinois Head Start Association, the purpose was to create a data dashboard to help communicate the Early Head Start and Head Start Program Information Report (PIR) to external audiences.
2. Audience
Understanding who the audience is when developing a dashboard helps us decide how to design the dashboard, which dashboard features to include, and which not to include.
The primary audience for Illinois Head Start Association was early childhood partners; the secondary audience was legislators and advocates.
3. Key Questions
Once we know the audience, we ask our clients, “What are we trying to answer, or what do we want to know?” from the data and information in the dashboard. There is so much data out there; we want to include it all, but that can overwhelm our audience. Knowing our key questions helps us to keep the data dashboard on a focus topic.
For the Illinois Head Start Association, their key research questions included:
- Where are Head Start programs located?
- How is Head Start meeting the need?
- What is the unmet need?
- How does Illinois Head Start serve children?
- What is the makeup of Illinois Head Start teachers?
4. Data Collection.
Once we know what data to answer our essential questions, it is time to collect and gather it. Collecting data can take time if you gather data from multiple public sources, or you may need to create a new method for gathering data that doesn’t exist. (Check out this blog to see our go-sources for data).
The Illinois Head Start Association they have a lot of data already through their federally funded local grantees. We also collected additional public data for context to answer their key data questions.
5. Features & Utilization
This is the fun part of developing a dashboard. What features do we want to include on the dashboard? (Check out this blog to learn more about different dashboard features).
We incorporated a new feature, a navigation panel for Illinois Head Start Association. The navigation panel included a way for the user to quickly navigate to different dashboard pages, a panel for other filters, and a help box. This navigation panel gave us more space on the dashboard to include more data! Here is a video highlighting the different features we had on the Illinois Head Start Association dashboard.
6. Decision-Making
We love gathering feedback from various stakeholders, but when the dashboard is ready to be published, who gets to make that final decision? One of the core values of our consulting approach is collaboration. We are co-designing our dashboards with the client throughout the process. At this step, we want to pull in any additional partners and stakeholders, such as an external funder, board of directors, or committee for that final stamp of approval before we launch!
With Illinois Head Start Association, we gathered feedback from their board before launching the dashboard.
7. Disseminate
The last step, and probably one of the most important, is how we are going to share the dashboard to ensure it is utilized and maintained. This step includes internal and external communication. For example, internally we want to ensure the dashboard is utilized and maintained, so we create a “How-to” guide for the client. Externally, we create a plan to make sure stakeholders know about the dashboard and how they can use it within their work.
For the Illinois Head Start Association, we created different images and social media copy for them to communicate externally to their stakeholders.
This data dashboard development process helps clients think about the essential pieces of the dashboard to make it a great product. Make sure you download our data dashboard development tool to develop one for your organization and explore the Illinois dashboard here. Or even better, reach out to us to talk data! Learn more here.