The data is out! We now have access to giving trends from 2021 and are looking at the implications these numbers will have on your organization’s strategies moving forward.
Giving USA 2022: The Annual Report on Philanthropy for the Year 2021 shows national giving last year remained strong following a record 2020, with individuals, bequests, foundations, and corporations giving an estimated $484.85 billion to nonprofits in 2021. 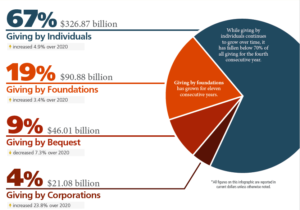
This report leads to some critical questions nonprofits should be asking themselves, especially around funding diversification. Did you know a majority (90%) of non-profit organizations report that they have one source of funding and that one source accounts for 90% of their total funding? When working with clients, we never recommend having an “eggs in one basket” approach to funding. The recent trend data supports the importance of diversification.
We pulled out key takeaways below:
- Charitable giving remained stable. Though total charitable giving in 2021 grew 4% over 2020 when adjusting for inflation, giving remained relatively flat with a 0.07% decrease.
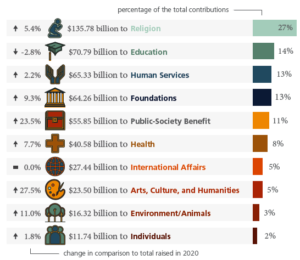
- Donors gave where they saw an increased need. Donors heard rallying cries around helping organizations supporting education and human services in 2020 and responded with increased giving in these areas. Similarly, in 2021, donors moved to save arts & culture organizations and gave in a big way to public-society benefit organizations after an increased national focus on racial justice.
- Foundation giving had a big year. Especially when looking at trends over time, foundations have taken on an increasingly important role in philanthropy. In 1981, foundations made up just 6% of overall giving, compared with 19% in 2021.
- Individual giving remains critical. Individual giving was below 70% of overall giving for the 4th year in a row in 2021, compared with 1981, when 83% was from individuals. That said, individuals remain the largest source of funding at 67%. It is important to note that mega-gifts totaled $15 billion and made up 5% of total philanthropic support from individuals in 2021.
- Corporate giving grew but consider the context. Corporate giving increased 23.8% over 2020, the largest increase amongst the four sources Giving USA tracks. This increase was largely driven by a strong economy (strong Gross Domestic Product and 37.4% increase in pre-tax profits). In fact, when looking at corporate giving as a percentage of pre-tax profits, corporate giving did not see significant growth.
Key Recommendations:
As our team sorts through this data ourselves, we recommend that you ask these critical questions to think strategically about your next steps as you work to meet funding goals and continue fulfilling your organization’s mission.
- Do you have diversified funding sources? As was mentioned earlier, a majority (90%) of non-profit organizations report that they have one source of funding and that one source accounts for 90% of their total funding. As funding sources cease to be dominated by individual giving and start to move towards a more equal distribution, it is important to understand your revenue distribution and ensure it supports your long-term stability and growth. We also know Baby Boomers are aging, and research shows they are preparing to transfer an estimated $30 trillion through their wills and estate plans in the next few decades. How can you be intentional about including these donors in your strategies? We have free tools available here to break down strategies for funding diversification and overall donor stewardship.
- Are you in a strong position to pursue foundation funding? Foundations are an increasingly critical funding source. According to the Harvard Kennedy School’s Center for Public Leadership’s Global Philanthropy Report, “Foundations are increasingly employing a range of social investment strategies to maximize their impact and there is a growing interest in evaluating and measuring program outcomes.” Are you using data to measure your impact? No? You aren’t alone: 60% of nonprofit professionals report that they don’t use data to make decisions, which can result in decreased funding and lack of progress. See how we use data to inform our work (including fundraising strategies) here.
- How do you make your organization stand out? Though overall charitable giving remains strong, the funding landscape also remains competitive. There are 1.5 million registered nonprofit organizations in the US. How do you make sure your impact is noticed? Using communication and marketing best practices, we work with nonprofit organizations, schools, and government agencies to tell your story of impact to ensure you stand out. Check out these tips for using data to tell your organization’s story.
We help you turn data into dollars! As you continue exploring these recent findings on giving, we would love to support your next steps. Let’s chat about how this data can set you up to meet your fundraising goals this year which will ultimately drive your organization’s impact!
View the full report here.