Our TCG team recently presented at the Fifth Annual Indy Big Data Conference for the Visualization Challenge (read about some of our lessons learned here). This year’s challenge focused on improving Indiana’s talent pipeline and workforce. 
Participating teams were provided several datasets to analyze and interpret, and then present to a panel of judges. Following the first round of presentations, the judges then awarded five teams the opportunity to present to 500+ conference attendees. Our TCG was one of those top five teams selected! Read more about the Visualization Challenge and data sets here: https://www.indybigdata.com/visualization-challenge/.
Our team used our Tableau expertise to create this interactive dashboard, and then we presented on our findings. The interactive dashboard addresses several key questions about the future of Indiana’s workforce and talent pipeline, including:
- What will be the top jobs in demand in 10 years?
- What is the education requirement for those top in demand jobs?
- What is the earning potential of those top in demand jobs?
- What is the return on investment on education for those top in demand jobs?
The following is a summary of TCG’s findings to these questions based on the data provided.
1. What will be the top jobs in demand in 10 years?
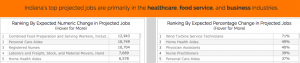
Indiana’s top projected jobs are found primarily in the healthcare, food service and business industry. TCG found that the top projected jobs in 10 years varies depending on how you look at the data. For example, Wind Turbine Service Technicians looks like the top in demand job, because of a 71% expected increase in positions in 10 years. However, when you look at the actual number of new jobs for Wind Turbine Service Technicians, there are only 66 total positions expected to be added over 10 years. This is not actually enough individual positions to create new higher education programs to encourage individuals to pursue this career. In this visual chart, you can scroll down to see the top projected jobs and how they compare. Hover over the number for more information about that occupation.
2. What is the education requirement for those top in demand jobs?
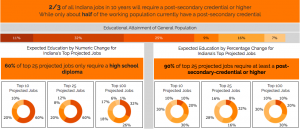
The U.S. Census Bureau reports one-third of working adults ages 18-64 have an associate degree or higher. An additional 25% of this population have some education beyond high school. Interestingly, we found that six out of ten of the top 25 projected jobs only require a high school diploma. This doesn’t mean that we should stop encouraging young people to pursue higher education. Instead, the trend looks like the largest amount of new positions will be entry level or positions that do not immediately require an education beyond high school.
3. What is the earning potential of those top in demand jobs?
TCG created a box and whisker plot chart to show the earning potential by occupation. For all occupations the median annual salary is about $40,000. The top 25 projected jobs based on the number of new positions shows a median annual salary at $31,000 which is below the current median annual salary. Again, this somewhat relates to the education level requirements in the previous section. The largest increase in projected new jobs are not high earning jobs. Visit the interactive dashboard to explore the different wage levels, experience levels, and hourly rates of the projected top jobs.

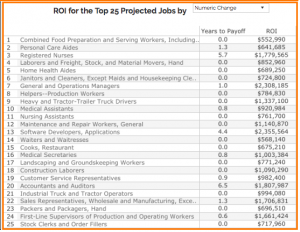
4. What is the return on investment on education for those top in demand jobs?
The costs of education can feel like a burden to individuals, especially when the costs drag on through student loans for several years. The average timeframe expected to pay off the cost of postsecondary education is over two years. Our TCG team was interested in calculating the return on investment (ROI) of pursuing higher education for the top 25 occupations. You can rank the list by the jobs with the highest and lowest ROI. The average ROI for all jobs is $1.4 million.
Recommendations
TCG made several recommendations from the data analyzed. (This list can also be viewed on the second tab in the interactive dashboard).
- Review employment projections in multiple ways, like reviewing the expected growth based on the number of new jobs and the percentage growth of new jobs (e.g., Wind Turbine Service Technicians example) to ensure informed decision making. This can assist with decision making when developing or removing educational degree or certification programs and when encouraging individuals to enter a certain field.
- Offer more certificates and associate degrees both independently and as a part of bachelor’s degree curriculum. It would align with required educational needs of the workforce, contribute to less debt for students, and help improve higher education completion rate.
- Increase partnerships with employers (like IU Health) to do more direct career pipelines and apprenticeship programs. This could also potentially reduce the student cost. For example, Graduate Assistant positions are partially funded by the organization that receives a graduate student.
- Include more experiential learning in degree programs. It would help the student decide if they are in the right major or explore a secondary interest. It could also get industries to partner with other majors/ disciplines. For example, get the “creatives” into STEM activities – increasing the workforce pipeline.
- Consider offering incentives to attract individuals in the top projected jobs, especially those jobs with a low ROI. Look at ways to make these jobs more attractive to meet the future workforce needs.
Learn more about the Indy Big Data Challenge in this article by the Indiana Management Performance Hub. At TCG, we are data nerds. Check out our research and analysis services, and learn how we can develop visual reports and dashboards to inform your decision-making and help you tell your story of impact.