

Is your organization financially healthy? How do you measure the financial health of your organization? Nonprofit, education and other community organizations can look at the financial health of their organization and its relationship to your impact. Financial health indicators also help make sure programs are being run efficiently and if any program changes need to be made.
For many organizations, financial information is used with staff and administrators and shared with boards, potential funders and clients. It is not always necessary to give each audience the detailed level view of an organization’s financial information. However, it is critical that the leadership of the organization is aware of and tracking some critical indicators that determine your financial health.
While working with ten early childhood education programs on reaching their financial goals, we first had to look at the overall financial health of the organization. We asked to see income statements, balance sheets, client/ service information and any other key financial indicators. It can be hard to make sense of all of this information, especially for staff and board members who are not accountants or financial advisors.
We saw a gap and need to summarize the most important financial indicators in a one-page overview that can be regularly (and automatically) updated for board meetings, funder reports, and other key reports. We were able to identify three key areas of information to highlight for different. While every organization is different, we believe these three financial areas are critical for every organization to track and monitor.
Three Financial Health Areas to Track for Your Organization
1. Participation
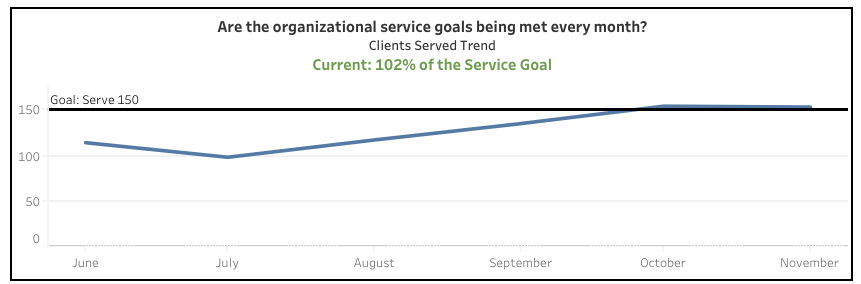
If you are an organization that receives funding based on participation or enrollment numbers, then this is a critical indicator for you to track. Just like a hotel tracks their vacancy rate, your organization should have set goals and benchmarks for participation or enrollment rates. These should be based on your budget and what is needed to “break even”. Then you can look more closely at your participation by different population groups and a calendar of enrollment.
The chart example below shows the trend in children served by month. The trend shows how the capacity fluctuated. It may be useful to take closer look at multiple years to see if the monthly trends are consistent by year. This will help organizations plan for the future.
2. Revenue & Expenses
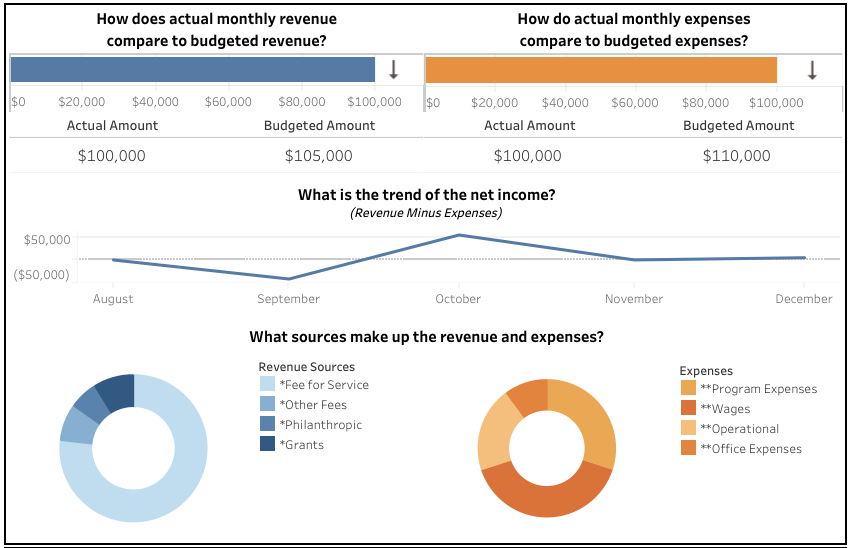
Looking at the overall revenue and expenses helps organizations see when more money is coming in compared to what is being spent. Comparing these funding sources helps make informed decisions on program changes when necessary.
For example, when we looked at the revenue sources for an early childhood education program, we saw a majority of funds were coming from government subsidized programs. This might be a risky revenue source to rely on for a program. We helped the leaders discuss what might be a healthier percentage to set as a goal for government funding and other funding sources. We encouraged the program to increase regular parent-pay enrollment and fundraising initiatives to create more balanced revenue streams.
The sample dashboard section below takes a deeper dive into the revenue and expenses of an organization. This includes:
- Budget versus actual revenue and expenses,
- Net income (revenue minus expenses) trend, and
- Sources of revenue and expenses.
As seen in the donut chart, the revenue and expense sources are each categorized into four main buckets. This makes the categories more understandable for a variety of audiences.
3. Account standings
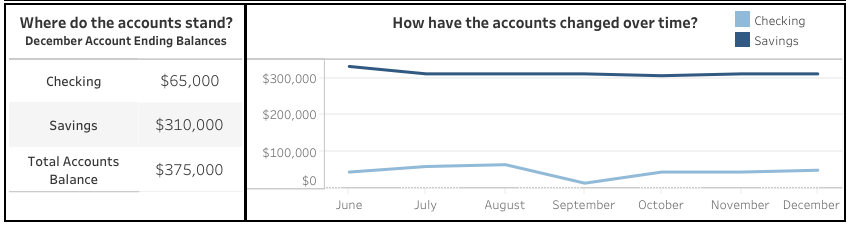
Looking at the organization’s account standings is a simple way to monitor any large fluctuations in the account. It also helps decision makers see how much money the organization has to work with at any given time. For example, a fundraising event that will have to be funded from the account can be approved if the board knows the appropriate funding is available in the accounts.
The dashboard below shows fairly consistent account amounts. The dip in checking in September could raise some questions. This is an opportunity for the organization to go back to the original sources to understand why.
We encourage organizations to collect information beyond these three areas. These areas are meant to give a snapshot and raise questions within the organization when necessary. As seen in the examples, we like to display these areas in a visually-appealing dashboard using Tableau Software. Interactive dashboards allow users to apply filters and easily update the dashboard every month or quarter. Organizations can use other methods to display information depending on the intended audience and the amount of information being shared. View our Dashboard Services page to find out how we can help you with your dashboard needs.
If your organization does not know where to start, this blog post may be helpful for understanding why financial goals are important. At TCG, we can help your organization identify what financial information to collect and recognize key areas to share with the intended stakeholders. If your program needs support evaluating your financial stability or creating a visually appealing financial dashboard, contact us today!