
The National Assessment for Educational Progress (NAEP) is the largest national assessment of American students. Sometimes referred to as America’s Report Card, the NAEP tests students in a variety of subjects including mathematics, reading, writing, and science. The NAEP is given every two years in all 50 states and in 21 large urban areas. In addition to academic questions, the NAEP asks students how many days of school they miss. Students are deemed to have poor attendance if they have 3 or more absences in a month.
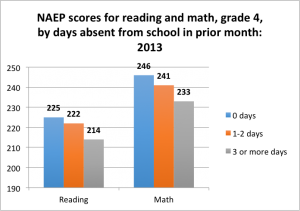
Absences Add Up: How School Attendance Influences Student Success, a report released by Attendance Works, uses data collected by NAEP to highlight the connection between a student’s attendance and achievement. The study confirms students with higher absenteeism rates in the month before they take the NAEP score lower on it. A state-by-state analysis determines this trend holds true at every age, in every demographic group, and in every state and city tested.
Absenteeism has lasting effects. As reported in Make Attendance in the Month of September Count!, research shows students with poor attendance in the first month of school are more likely to experience “chronic absenteeism” (missing more than 10 percent of the school year). A Johns Hopkins University study shows as early as the 6th grade that absenteeism is an indicator a student will drop out between 8th and 12th grade.
The NAEP shows conclusively how absenteeism can undermine a student’s ability to achieve in school. While absenteeism is a challenge in every state, Indiana rates of attendance are among the nation’s best at the fourth and eighth grade levels.1
Transform Consulting Group has helped many organizations collect data to identify their issues, trends, and impact. Has your organization considered using data collection and analysis to measure impact? Contact us today for a free consultation!