Indiana’s Early Learning Advisory Committee (ELAC) released its 2019 ELAC Annual Report. Each year, ELAC completes a needs assessment of the state’s early childhood education system and recommends solutions.
We want to share some quick highlights and key takeaways from this year’s needs assessment. ELAC ensures that early childhood education is accessible, high-quality, and affordable to all families.
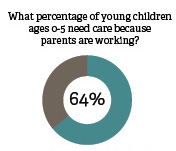
Are Children Ages 0-5 Receiving High-Quality Care?
- Of the 506,257 children in Indiana ages 0-5, 64% need care because all parents work. This includes working parents who are single and households where both parents work outside the home.
- Of those children who need care, only 40% are enrolled in known programs. The other three-fifths of children receive informal care—from a relative, friend, or neighbor.
- Of the young children who need care, only 16% are enrolled in high-quality programs. A high-quality early childhood education program ensures that children are safe and supports their cognitive, physical, and social-emotional development.
Are Children in Vulnerable Populations Receiving High-Quality Care?
- Indiana makes funding assistance available for early childhood education for children from low-income families.
- Indiana does not collect data on children in other vulnerable populations, such as children in foster care and children affected by the opioid epidemic.
- Due to a lack of data, Indiana needs to know the kind of care children receive in vulnerable populations.
What Trends Are There in Early Childhood Education?
- Since 2014, Indiana has made progress by enrolling more children who need care in known early childhood education programs.
- Over the past five years, Indiana has consistently enrolled fewer infants and toddlers than preschoolers in known, high-quality programs.
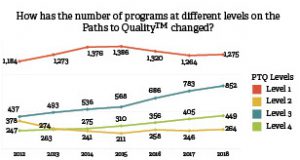
- Compared to 2012, more early childhood education programs are participating in Paths to QUALITYTM, Indiana’s quality rating and improvement system.
- In addition, significantly more programs have earned high-quality Level 3 or Level 4 designations since 2012.
What Trends Are There in the Early Childhood Education Workforce?
- Indiana’s early childhood education workforce is more diverse than the K-12 workforce but not as experienced.
- Nationally, the early childhood education workforce earns $4-$7 less per hour than the average hourly wage of all occupations.
What is the Unmet Need in the Early Childhood Education System?
- There has been a persistent need in early childhood education programs for more available spots for infants and toddlers.
- Despite overall improvements, there are still some communities in Indiana that still need high-quality early childhood education programs.
- The tuition cost of high-quality early childhood education programs remains unaffordable, and the available financial assistance for low-income families needs to be increased.
How Can I Find Out More?
- Read the 2019 ELAC Annual Report, which includes statewide data on Indiana.
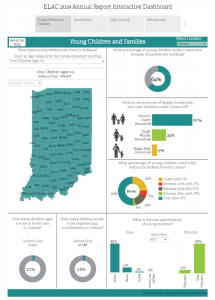
- ELAC also publishes an interactive dashboard that allows you to learn more about specific data points. You can also easily present data to stakeholders.
- The interactive dashboard contains both state- and county-level data. Use the map to select your county, and hover over the data to learn more!
Transform Consulting Group is proud to support ELAC’s work by pulling together this needs assessment and interactive report!
Does your organization, agency, or coalition need to better understand your community or a vital issue, but you don’t know how to get started? We are skilled in collecting quantitative data from multiple data sources and pulling it together in a visually appealing, user-friendly report. Contact us to learn how we can help you complete your needs assessment!