 Is your organization working to get more students to and through college? How are you tracking your results and their progress? For many schools and organizations, this can be difficult because you are not in direct communication with the students anymore.
National Student Clearinghouse
One solution to track post-secondary attainment rates is the National Student Clearinghouse (NSC). NSC has information covering about 96% of all U.S. enrollment in public and private collegiate institutions. The NSC data includes information on college enrollment, degree types, institution type and dropout and graduation rates.
NSC data will answer several of your key questions, including:
- How many students are enrolling in post-secondary education and when (1st year after high school or 3 years later)?
- What colleges or institutions are students selecting?
- How long are students enrolling (it tracks by semester)?
- What majors and minors are students selecting?
- How many are withdrawing or dropping out?
- How many are graduating?
Here at Transform Consulting Group, we have analyzed NSC for several organizations working to get more students to and through college, such as TeenWorks and the Center for Leadership and Development. We have identified 4 tips to help your school or organization collect, understand, and analyze NSC data.
1. PREPARE YOUR DATA
Before you can get an update on the status of your students/ alumni’s post-secondary information, you must first submit a data request to NSC. NSC is very specific about how they want to receive your student file. Review NSC’s specific format for submitting your data request.
2. REVIEW AND CLEAN DATA
Now that you have correctly submitted your data request to NSC, they will return an aggregate data sheet and a student data sheet.
The aggregate data sheet gives a summary of the entire data set, including the top institutions attended, 4-year versus 2-year enrollment, number and percent awarded degrees, public versus private attendance, and in-state versus out-of-state attendance.
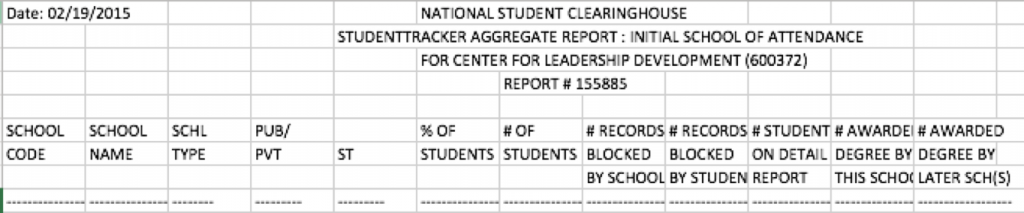
When you see the returned student data sheet, it may seem overwhelming! The sheet breaks down 33 data points organized by column for each student found in the database. This data sheet will help you answer the above key questions.
To help avoid that overwhelming feeling, NSC created a “StudentTracker Detail Report Excel Guide for Colleges and Universities”, breaking down the detailed steps to help understand and use the information. Essentially, you will spend a significant amount of time cleaning and formatting the data. Then you can analyze the data in Excel (using pivot tables) or a data analysis software. We like to use Tableau to analyze our clients data, which you can read about here.
3. ALIGN DATA
Hopefully, now that overwhelmed feeling is gone! In order to take your NSC data to the next level and really understand what is working and not working at your school or organization related to postsecondary attainment, you need to combine your NSC data with some of your internal data. Take your returned student sheet data file and match it with some of your internal data. Then you could answer some additional key questions:
- What impact did ______ program have on our students’ postsecondary rate?
- Did students who were involved in more programs or multiple years at our organization have higher postsecondary rates?
- Did different groups of students (low-income, first generation college grads, gender, race, geographic neighborhoods, etc.) have higher or lower postsecondary rates?
This further alignment and assessment of comprehensive data helps you identify which programs and services lead to the best or worst outcomes for students.
4. SHARE THE INFORMATION 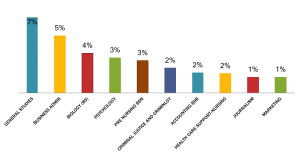
Now what? You have your postsecondary outcomes with the context of additional program information, but how are you interpreting the data and sharing it internally and externally with key stakeholders? We recommend creating visuals to highlight the key data points. Studies show that a majority of people are visual learners. We suggest checking out a series of blogs Transform Consulting Group has written about creating infographics and other visuals to help tell the data story. Lastly, and most importantly, you can now make data informed decisions to improve your postsecondary outcomes!
Conclusion
Data not your thing? Still feeling overwhelmed by the NSC process and information? Transform Consulting Group is here to help. Learn more here. We have worked with several schools and organizations to help make sense of their postsecondary outcomes and National Student Clearinghouse data. Contact us today to learn more about how we can help!