Congratulations! You successfully gathered data to look deeper into the effectiveness of your programs, decided WHO you’re sharing the information with and now it’s time to figure out HOW to share the data.
We talked about the different audiences you should share your data with in this blog, such as internally with staff and volunteers and externally with funders and partners. Once you determine your audience, you may decide on a variety of ways to communicate your latest information.
First, it’s important to know your audience and be willing to shape your message in a way that is easy to understand and compelling. Some things to consider about your audience may include their age, educational background, industry or non-industry, and economic levels. For example, the way you communicate to a wealthy, influential donor should look different than the way you communicate to your staff or clients.
Here are some examples of how you can share data with a variety of audiences:
-
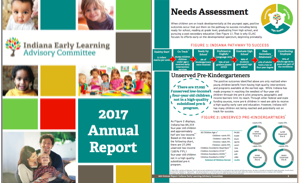 Annual Report
An annual report is a great way to package your year’s efforts and data. You can use several visual elements to make important data stand out, include photos of the people you serve, while also including descriptive text to provide additional information. For tips on how to spice up your annual report, check out this blog
-
Email Blast
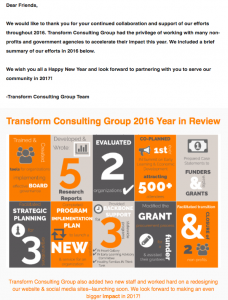
Many of you are already regularly emailing your target audience, so consider using those email blasts to spotlight recent data. If your data shows positive results of a programs, then share it! Include photos or success stories from clients to highlight and make sure you’re presenting the facts in an “easy-to-read”, visual way.
We did this at TCG and sent out a “Year in Review” email blast to current and potential clients highlighting our efforts and successes throughout the calendar year.
-
Marketing Materials
If your data is showing huge successes, then you want to make sure EVERYONE hears about it!
- Brochures: Consider re-creating marketing materials to highlight specific results and outcomes beyond just the standard details about programs provided and “numbers served”.
- Letterhead: Add a simple line at the bottom of your organization’s letterhead such as “95% of students enrolled in our summer programs saw significant improvements in test scores.”
- Email Signatures: Have all staff members update their email signatures to include a link to the Annual Report or another statement on a specific data point.
The great thing about using marketing materials is that you are able to communicate data to people outside your circle. EVERYONE who receives an email or letter from you can see your data and it doesn’t have to be a person who already has a stake in your organization.
-
Social Media Campaign
Your data tells a story about your organization and social media platforms are great for sharing!
- Upload your Annual Report online and share the link often on your channels.
- Share pieces of data from the annual report on a weekly basis through a specific data point or graphic.
- Swap out your Facebook or Twitter banner to highlight a specific success.
- Make your social media posts visual! One tip to keep in mind: before you post long winded paragraphs
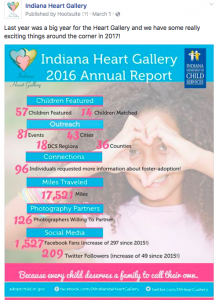 packed full of numbers, try creating infographics to communicate the data in a visual way. You can then upload your infographics as photos on your social media channels and make it easy for your followers to share.
We did this recently when sharing 2016 stats for the Indiana Heart Gallery to our social media followers. While the infographic to the right doesn’t tell the whole story, it does gives a quick look at the numbers. For more tips on creating infographics, check out our past blogs here and here.
It’s important to note that the examples listed above are just a starting point. The great thing about sharing data and telling your story is that the possibilities for HOW you do it are endless. Get creative and don’t be afraid to try out new things!
Whether you’re at step one and need help gathering data or you already have great data compiled and need help sharing it, contact Transform Consulting Group today and we’d love to chat!